
| Back | Gene Expression defining boundaries in the brain at CS19 |
|
|
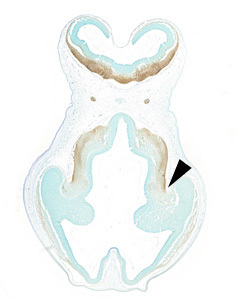
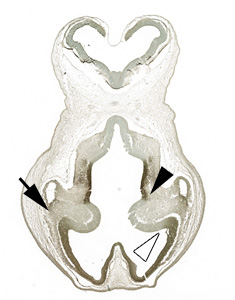
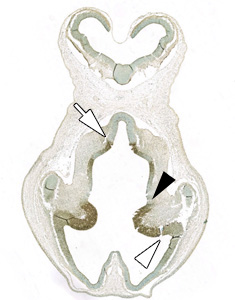
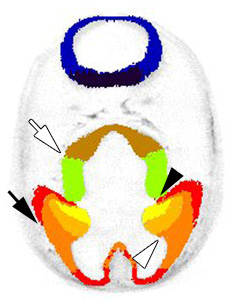
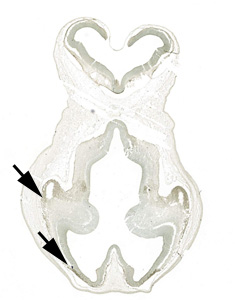
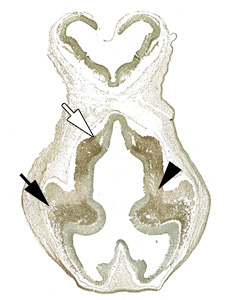
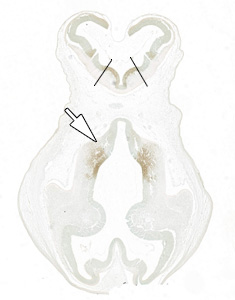
Here data from immunohistochemical experiments has been compared with the digitally painted CS19 model. When the sections are aligned it becomes evident that that the gene expression patterns define boundaries between different anatomical regions: Black arrowhead - diencephalon/telencephalon boundary. Black arrow - pallial/subpallial boundary. White arrowhead - boundary between lateral and medial ganglionic eminences. White arrow - boundary between the prethalamus (prosomere 3) and the hypothalamus. Black lines - boundary between the alar and basal plates in the hindbrain. Click on the gene expression images for a higher magnification view. |
||
|
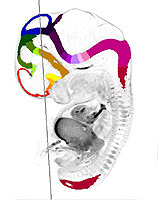
Key to painted anatomy:
Pallium, Lateral Ganglionic Eminence, Medial Ganglionic Eminence, Preoptic and Diagonal Band Areas, Hypothalamus, Prosomere 3, Prosomere 2, Prosomere 1, Midbrain, Isthmus, Rhombomere 1, Rhombomere 2, Rhombomere 3, Rhombomere 4, Rhombomere 5, Rhombomere 6, Rhombomeres 7-11, Spinal Cord.